📈 My Work
Here I highlight some of the projects I have worked on throughout my professional career.
I have econometric, classification, regression, clustering, recommendation systems, financial, and data analysis projects.
💲 Econometris using Python
I have a strong interest in Econometrics, particularly in Time Series Analysis. I aim to apply my knowledge to both univariate series analyses, such as ARIMA and SARIMA, and multivariate series analyses, such as Autoregressive Vectors (VAR) and Vector Error Correction (VEC). I also seek to learn and work on projects involving Difference-in-Differences, Causal Impact, Granger Causality, and Propensity Score Matching. For now, here are some of my econometric projects:
How to Forecast Revenue with Time Series in Python: A Case Study from Olist
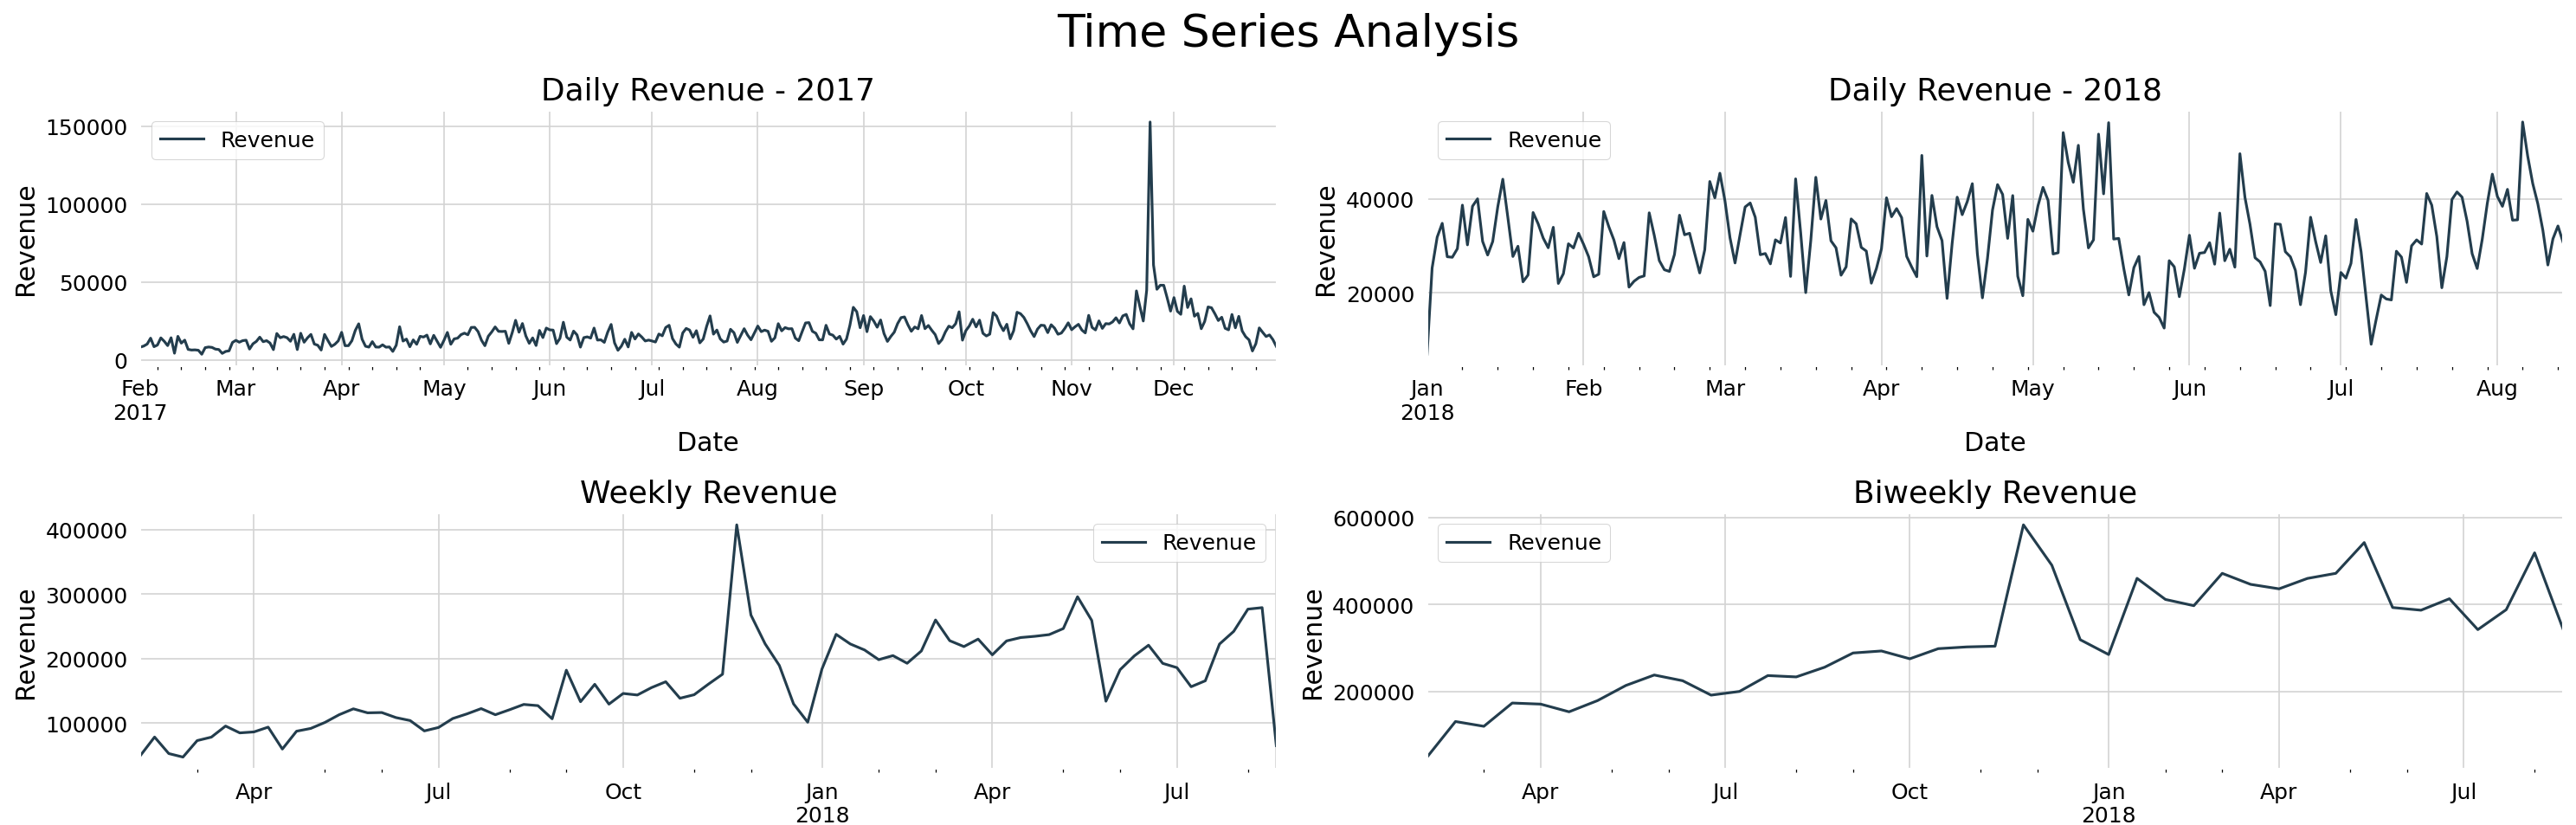
Business Problem:
- Olist faced a challenge in managing its revenue due to unexpected fluctuations in sales.
- Higher sales were expected during this time of the year, but external factors made it difficult for the company to anticipate its financial situation.
Goals:
- To address this issue, using the univariate Time Series methodology ARIMA is a good choice for forecasting revenue for the next two weeks.
- The main goal is to provide Olist with robust forecasting models capable of predicting revenue for the next 14 days.
Results:
- Overall, the models produced good results with small relative errors.
- The Auto ARIMA and SARIMA models stand out for their ability to capture future data fluctuations.
- Armed with forecasting models and insights, Olist can predict revenue to improve its financial organization, optimize necessary resources, and plan future investments.
Tools Used:
- Seasonal decomposition
- Augmented Dickey-Fuller (ADF) and Kwiatkowski-Phillips-Schmidt-Shin (KPSS)
- Autocorrelation Function (ACF) and Partial Autocorrelation Function (PACF)
- Auto ARIMA, ARIMA, and SARIMA
View the full project on GitHub: GitHub
Read about the project process on Medium (English): Medium
Price Elasticity of Demand Project

Context:
- In this fictitious project, I explore the price elasticity of demand for laptops and computers.
- The analysis uses fundamental principles of price elasticity to uncover insights that can guide strategic decision-making.
Goals:
- Select the store's best-selling category with the most sales to apply the analysis
- Understand how price variations impact consumer demand for elastic products
Results:
- Exploratory Data Analysis with various insights
- Table with names of elastic products, current revenue, and the potential variation in revenue both in monetary values and percentages
- The project demonstrates the importance of economic modeling for businesses
Tools Used:
- Pandas, Numpy, Matplotlib, Seaborn
- Exploratory Data Analysis
- Statsmodels
- Streamlit App
These projects demonstrate my experience in applying econometric techniques to real-world problems, particularly in demand forecasting and analysis.
📊 Data Science Projects
Introduction
The following projects were all developed in Python, following the CRISP-DM (Cross-Industry Standard Process for Data Mining) methodology. Each project focuses on solving a specific business problem, using data analysis and machine learning techniques to gain insights.
Classification Projects
Classification of InStyle Customers

Business Problem:
- The fashion store InStyle faces significant challenges related to customer experience.
- The team was tasked with training an algorithm to classify customers as "Satisfied" or "Neutral or Dissatisfied," predicting dissatisfied customers to act quickly and reverse the situation.
Goals:
- Generate insights from the data.
- Produce visual information about the customer base.
- Classify and identify dissatisfied customers using a machine learning algorithm.
Benefits:
- Increased customer satisfaction.
- Loyalty and retention.
- Efficient marketing targeting.
- Cost optimization.
- Workflow optimization.
Tools Used:
- Pandas, Numpy, Matplotlib, Seaborn.
- Exploratory Data Analysis.
- Logistic Regression, RandomForestClassifier, XGBClassifier, LGBMClassifier.
- Accuracy, Precision, Recall, F1 Score, Classification Report, and Confusion Matrix.
- Cross-Validation and Hyperparameter Tuning (RandomizedSearchCV).
View the full project on GitHub: GitHub
Cardiovascular Disease Detection

Business Context:
- Cardio Catch Disease is a healthcare company specializing in the early diagnosis of cardiovascular diseases.
- Its business model offers this early diagnosis of cardiovascular diseases for a specified price.
- The problem is that the diagnostic accuracy ranges from 55% to 65%, reflecting its complexity and the limited availability of doctors.
Goals:
- Create a model that improves diagnostic accuracy in a stable and efficient manner for all clients.
- 1. Accuracy of the new model.
- 2. What revenue does the new model generate?
- 3. How reliable are the results of the new tool?
Results Achieved:
- The model's accuracy is now at 75%.
- New revenue of $173,665,751.75.
- The new model generates an increase of $68,665,751.75.
Tools Used:
- Pandas, Numpy, Matplotlib, Seaborn.
- Exploratory Data Analysis.
- Logistic Regression, ExtraTreesClassifier, RandomForestClassifier, LGBMClassifier.
- Accuracy, Precision, Recall, F1 Score, Classification Report, and Confusion Matrix.
- Cross-Validation and Hyperparameter Tuning (RandomizedSearchCV).
View the full project on GitHub: GitHub
Reression Projects
Rossmann Sales Forecast

Business Problem:
- The CEO of the Rossmann pharmacy chain plans to renovate its stores as the brand is undergoing a rebranding, but does not know how much each store will have available to invest in the renovations.
Solution:
- Several Machine Learning models were tested to forecast the stores' revenue for the next six weeks, with the goal of predicting how much money each Rossmann store will have available to spend on its renovations.
Results:
- Through a comprehensive Exploratory Data Analysis, the company obtained valuable insights into the factors influencing sales, providing a solid basis for decision-making.
- The project successfully delivered a Sales Forecasting Model to optimize the allocation of resources for Rossmann store renovations.
Tools Used:
- Pandas, Numpy, Matplotlib, Seaborn, Scikit-learn.
- Exploratory Data Analysis.
- Robust Scaler, Min-Max Scaler, Label Encoder.
- Linear Regression, Lasso Regression.
- Random Forest Regressor, XGBoost, LightGBM.
- MAE, MAPE, MSE, R².
- Cross-Validation.
- Hyperparameter Tuning.
View the full project on GitHub: GitHub
Taxi Destination Prediction
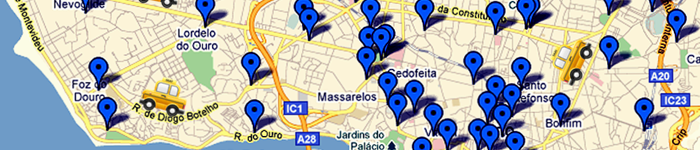
Business Context:
- With new technologies, the taxi industry needed to reinvent itself to keep up with its new competitors.
- One of the challenges is the new real-time dispatch system, which does not define the final destination of the rides.
- Due to this problem, the proposal is to develop a predictive model capable of inferring the final destination of taxi rides based on their pickup locations.
Goals:
- Understand the business problem.
- Analyze the travel data.
- Develop a destination prediction model.
- Present findings describing the problem and conclusions.
Performances:
- The final model (LightGBM) performed well with satisfactory results, with errors smaller than 1 km.
- Minimization of empty mileage.
- Increased customer satisfaction.
- Resource optimization.
- More trips in less time.
- Operational planning.
- Competitive advantage over ride-hailing apps.
Tools Used:
- Pandas, Numpy, Math, Matplotlib, Seaborn.
- Folium.
- Exploratory Data Analysis.
- LGBMRegressor.
- Mean Absolute Error, Mean Squared Error.
- Pickle.
- Hyperparameter Tuning with GridSearch CV.
View the full project on GitHub: GitHub
Clustering Clients
Clustering Clients for Makerting Campaign

Business Context:
- The central challenge is to enhance business and marketing strategies.
- By performing customer clustering using the K-Means algorithm, it becomes possible to understand customer behaviors and personalize strategies.
Main Objective:
- Segment customers into distinct clusters with K-Means, understand their behaviors and preferences, and improve strategy targeting for each group.
Results Achieved:
- Insights into registered customers and valuable information about the cluster groups.
- Customized campaign strategies for each group, adjustments to products and prices based on their preferences, and approaches to engaging each customer group.
- Cluster 0: Highest potential; Cluster 1: Growth opportunities; Cluster 2: High profitability; Cluster 3: Seek engagement.
Benefits:
- Benefits include more effective marketing strategies, personalized approaches, improved customer experience, and resource optimization to enhance business impact.
Tools Used:
- Pandas, Numpy, Matplotlib, Seaborn.
- Normalization, Weight Assignment.
- Elbow Method.
- K-Means.
View the full project on GitHub: GitHub
Recommendation Systems
Beyond "you may also like..."

About the Company:
- Rex London, an e-commerce retailer in the UK, aims to increase engagement and enhance customer experience.
- The challenge is to understand which products are frequently purchased together, with the goal of building a personalized recommendation system.
Goals:
- Conduct Exploratory Data Analysis (EDA) to understand behavior patterns.
- Use Market Basket Analysis to identify associations between products.
- Develop a Recommendation System based on customer similarity.
Results:
- The EDA revealed insights into purchases, products, consumer behavior over time, and the relationship between price and quantity.
- Market Basket Analysis identified product association patterns, classifying items that are frequently bought together, boosting sales of these products.
- The Recommendation System generated product suggestions for customers based on their similarity to others, maximizing the relevance of recommendations.
Tools Used:
- Pandas, Numpy, Matplotlib, Seaborn, Scikit-learn.
- Exploratory Data Analysis (EDA).
- Apriori, Association Rules.
- Cosine Similarity.
View the full project on GitHub: GitHub
Financial Projects
Credit Scoring for Conservative Bank

About Credit Score:
- A crucial tool for financial institutions to assess their clients and the amount of money involved.
- The analysis includes various factors such as annual income, home ownership status, loan amount, and interest rates charged.
Objective:
- Conduct a credit scoring analysis to increase the profitability of a conservative bank.
- Perform a detailed Exploratory Data Analysis (EDA) to better understand the dataset and its distribution.
Results:
- The final outcome is a table with clients segmented into categories.
- Relevant information for each category includes the number of clients involved, how many are good, how many are bad, the percentage of bad clients avoided, and the profit that each client selection provides.
Tools Used:
- Pandas, Numpy, Matplotlib, Seaborn, Scikit-learn
- Exploratory Data Analysis (EDA)
- Encoders
- KNN Imputer
- RandomForestClassifier
- LightGBM, CatBoost
- Confusion Matrix, Classification Report, Accuracy Score, ROC Curve
View the full project on GitHub: GitHub
Fraud Detection

The Importance of Fraud Detection:
- The repercussions of fraud extend beyond financial losses, including damage to reputation, deterioration of customer trust, and potential legal ramifications.
Objective:
- Build a defense mechanism for the financial institution based on data science techniques to strengthen the security infrastructure and enhance decision-making accuracy.
Final Result:
- The high Recall score provides confidence to proceed with this model in the next stages of the financial institution's project, identifying fraud when necessary.
Tools Used:
- Pandas, Numpy, Matplotlib, Seaborn, Graphviz
- Exploratory Data Analysis (EDA)
- SMOTE
- One-Hot Encoding, Label Encoder, Robust Scaler
- Logistic Regression, Decision Tree Classifier, Random Forest Classifier
- Confusion Matrix, Accuracy, Recall, Precision, F1 Score
- ROC Curve, ROC AUC Curve
- Hyperparameter Tuning, Randomized Search CV
View the full project on GitHub: GitHub
📝 Data Analysis Projects
This is one of the projects I developed to improve my data analysis skills. I address business questions through data exploration and interactive charts using the Plotly library.
Exploratory Data Analysis for Olist

Business Context:
- Olist is an e-commerce company in Brazil that offers a wide range of products on its platform.
- The company recognizes the importance of improving its operational efficiency, and the first step is to gain a deeper understanding of consumer behavior, order variations, sales patterns by region, differences in prices and shipping costs by state, customer satisfaction, and more.
Objective:
- Conduct an Exploratory Data Analysis (EDA) with the company's data covering various business areas, such as orders, products, consumers, and regions, in order to provide high-quality information for strategic decision-making.
Conclusion:
- The analysis provided several business insights, such as pricing descriptions, order characteristics, temporal trends, payment preferences, regional and daily patterns, the relationship between delivery time and order rating, etc.
Tools Used:
- Pandas, Numpy, Plotly Express
- Exploratory Data Analysis
View the full project on GitHub: GitHub